Customers

Trusted by data and AI teams.
Across enterprises and startups.

Highlights

The average time code changes take from their first commit to when they reach production

MeanLeadTimeForChanges

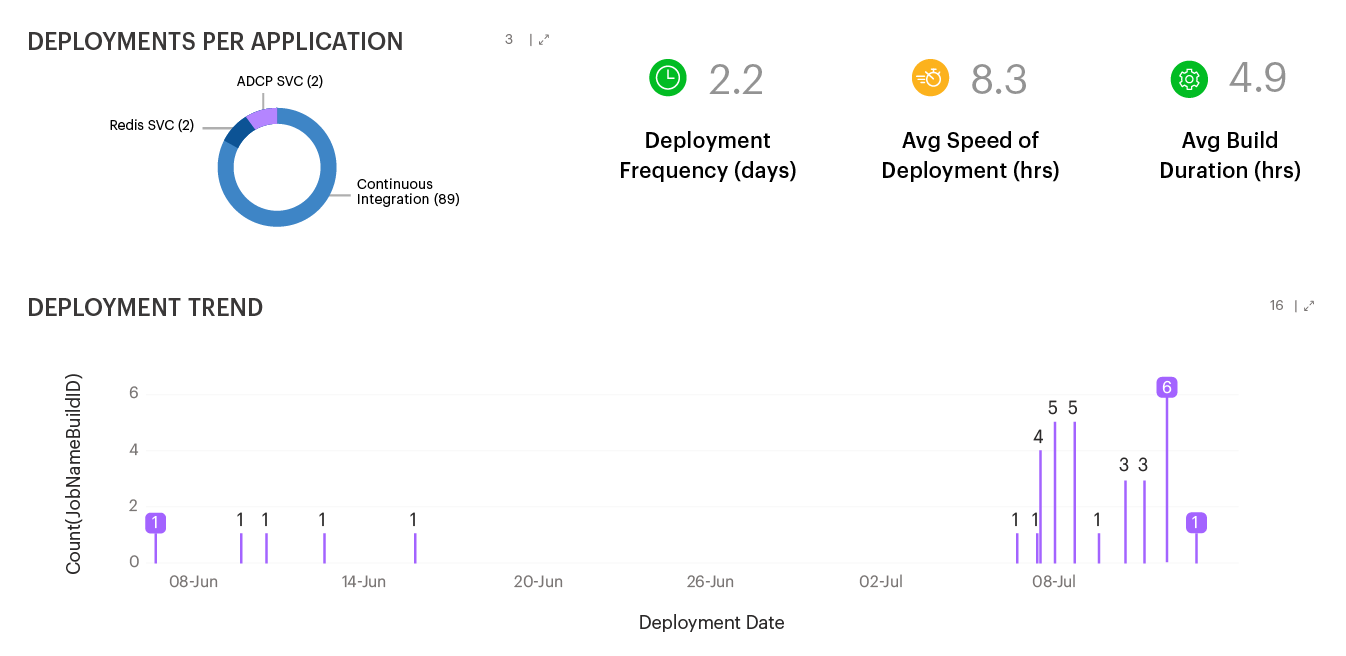
The number of times code is deployed to production over a period (day, week, month)

DeploymentFrequency

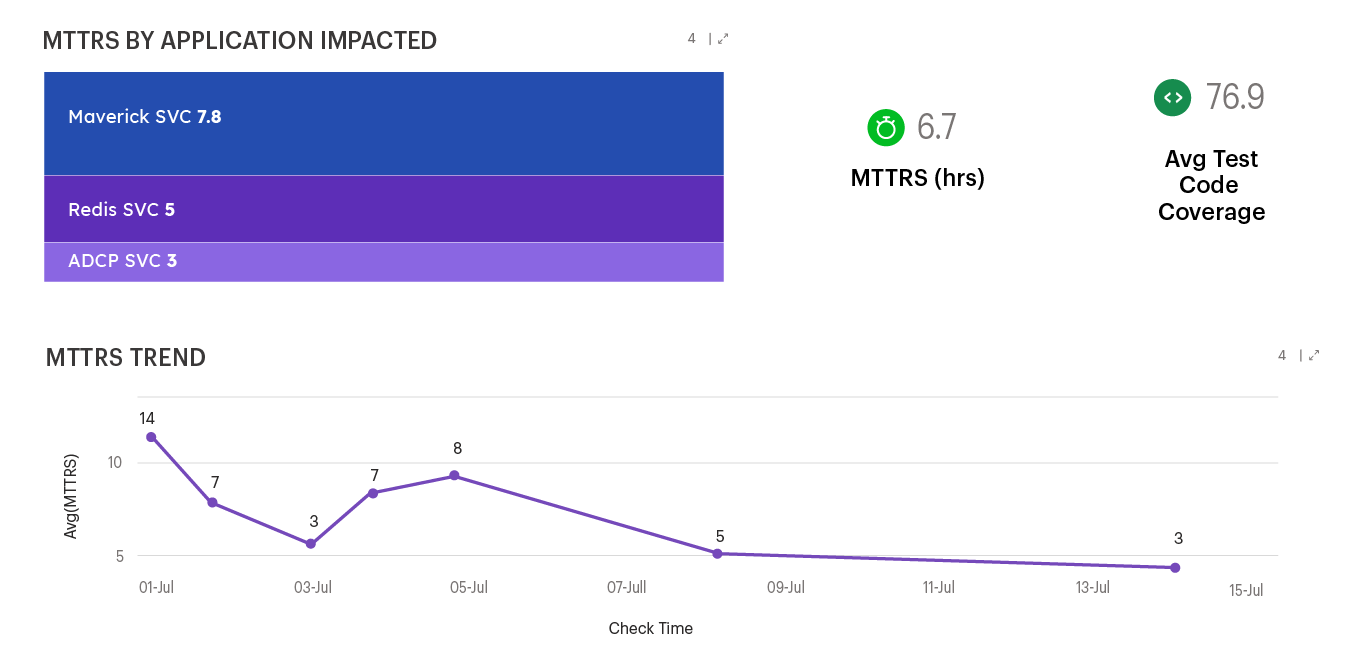
The average time a team takes to restore service or resolve a bug from the time it’s logged into the system

MeanTimeToRestoreService

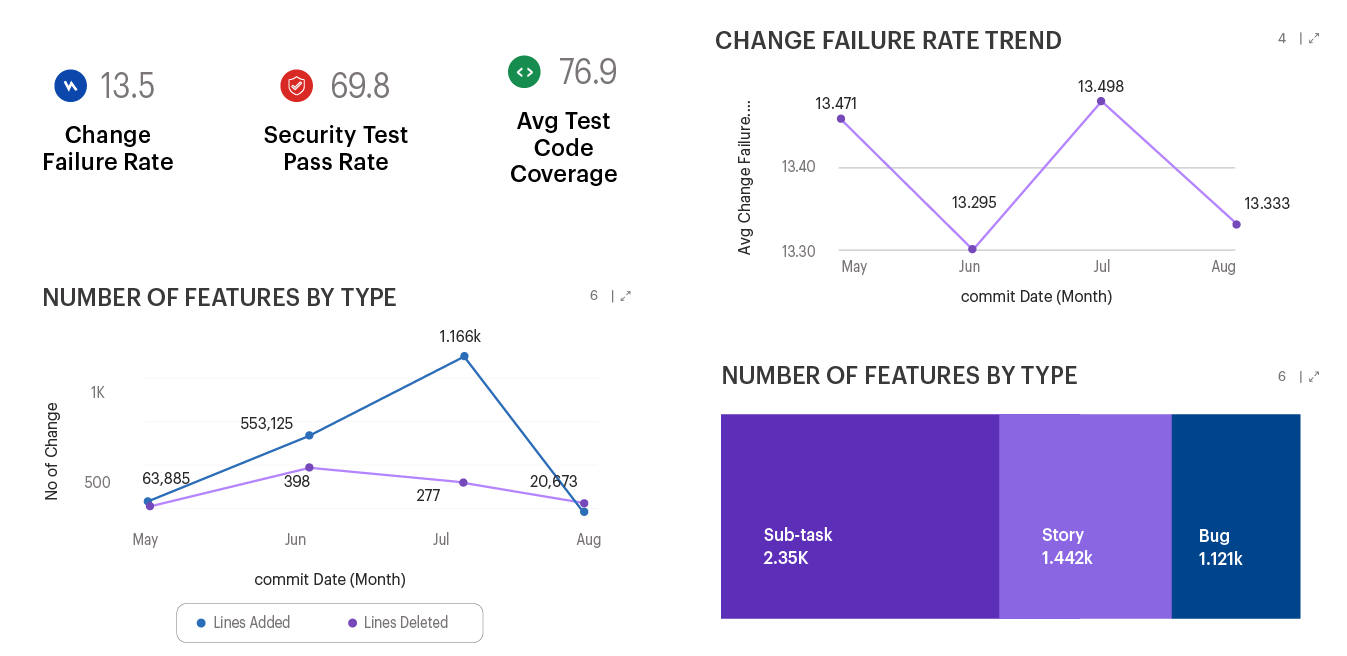
The percentage of code changes leading to a failure in production and requiring remediation steps such as hotfixes and rollbacks

ChangeFailureRate

Recently, DORA has introduced a new metric for measuring operational performance as Reliability. It is an aggregated metric based on availability, latency, performance, and scalability parameters.

Advantages

50x

More frequent code deployments

100x

Faster lead time between committing & deploying

3x

Lower change failure rate

400x

Faster recovery from incidents

Gathr Optics

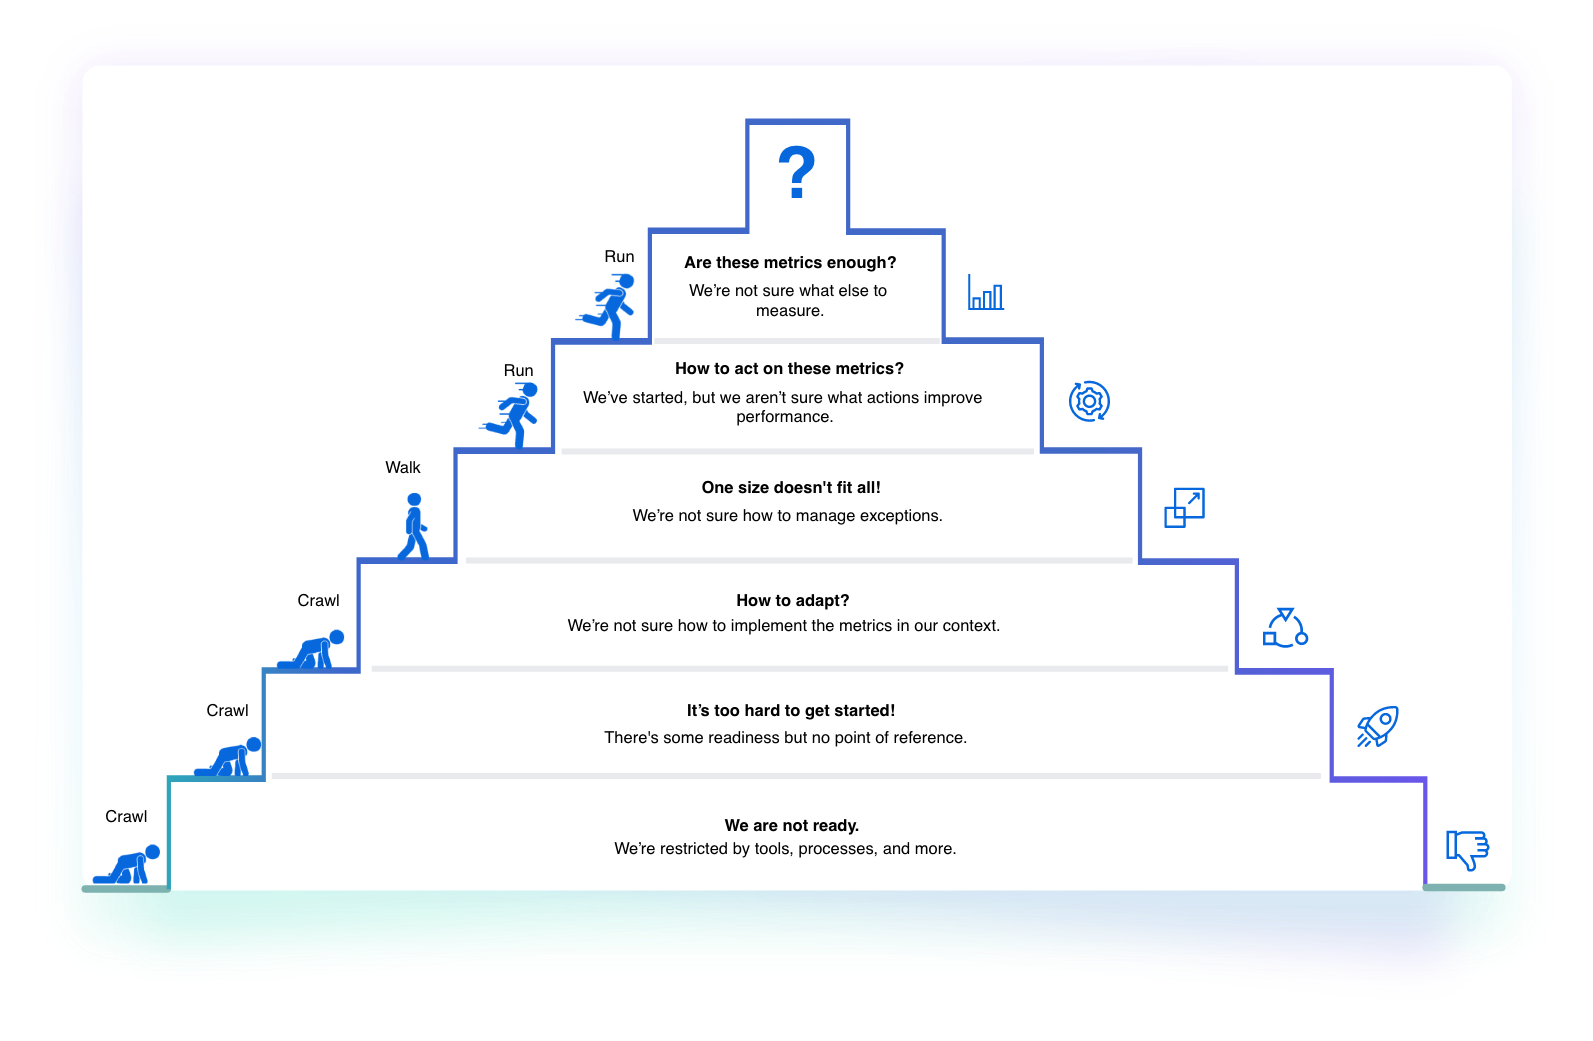
Where do you see yourself in terms of DORA metrics implementation?

When asked about their DORA metrics implementation & success, here’s how most organizations respond.

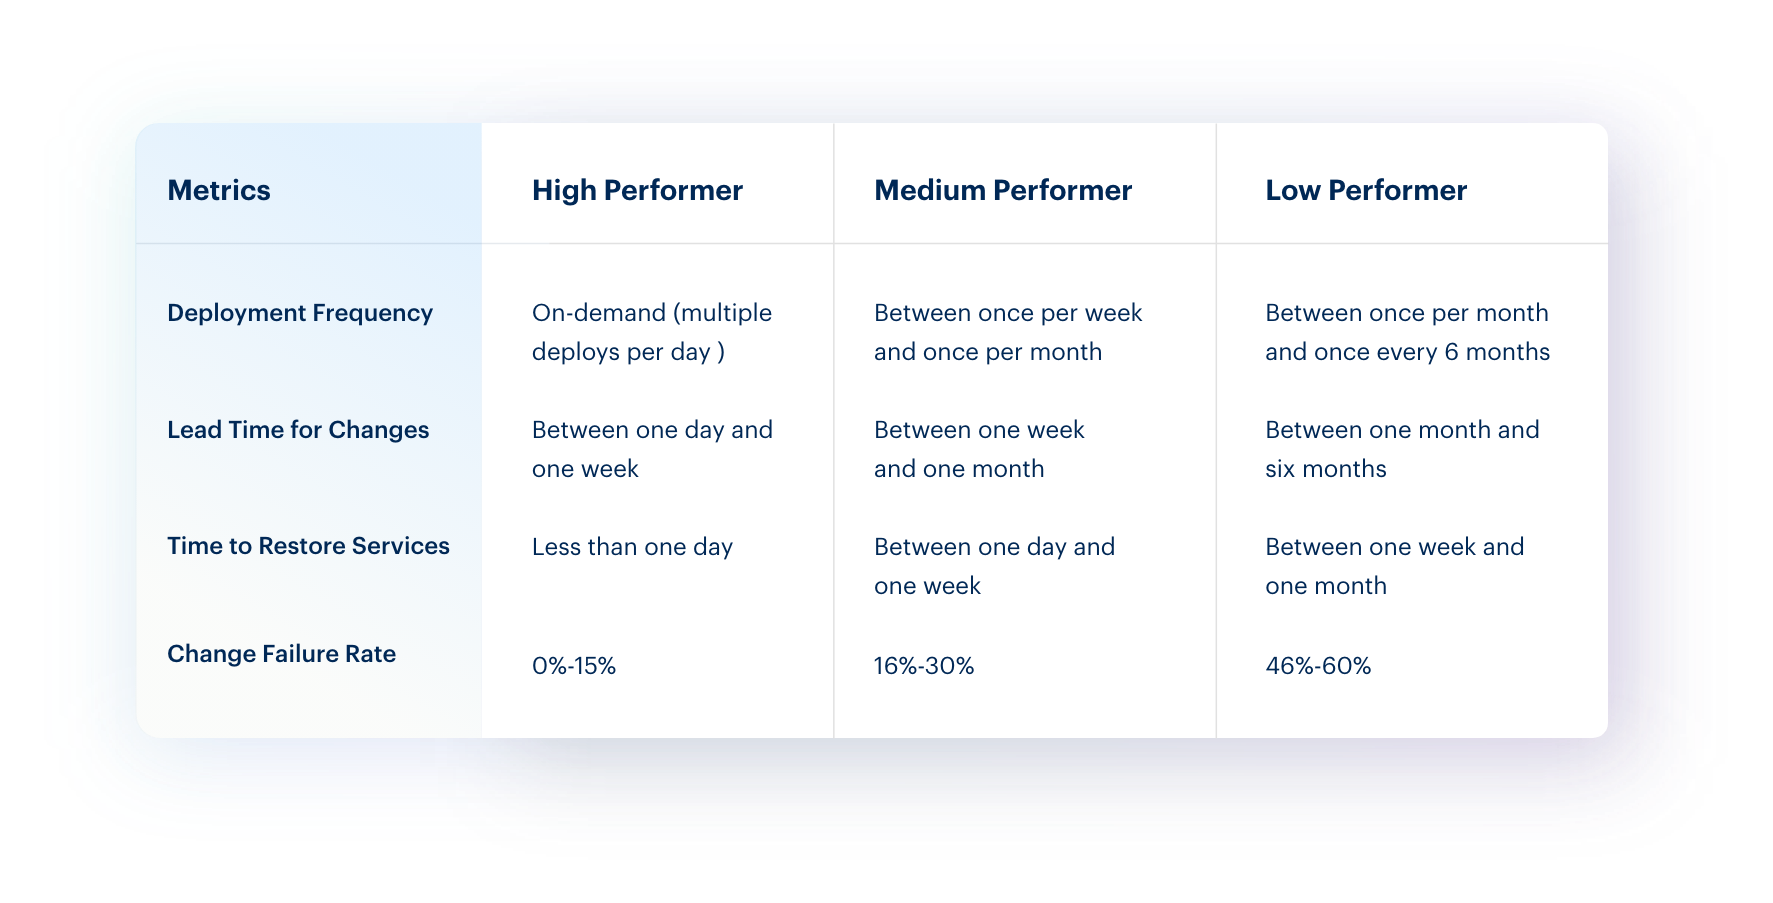
How do you compare yourself to industry peers?

For your reference, here’s how DORA categorized organizations as high*, medium, and low performers in its Accelerate, State of DevOps 2022 report.

Transition from ‘crawl’ to ‘run’ and the next steps to become a high performer with Gathr

Irrespective of whether you are getting started with DORA metrics or unsure about the next steps to be an elite performer,Gathr can help you make the most of DORA metrics.

White Paper

DORA Metrics and Beyond

Continuously Monitor and Optimize DevOps Performance

Download Now

Solution Details

Deep Dive Into DORA Metrics

Boost your DevOps health and performance with timely optimization.

  • Ineffective Analysis

    Cross-tool data correlation, trend-analysis and delivery flow assessment is difficult.

  • Lack of Automation

    Manual data collection from multiple disparate tools for project management, SCM, CI/CD, ticketing, etc.

  • Lack of Flexibility

    Most tools do not allow to implement custom metrics, ormetrics or extend the scope beyond DORA.

DORAMetrics-MonitoringChallenge
  • Ready Integration

    Use out-of-the-box connectors to unify data across tools and calculate DORA DevOps metrics.

  • Visual Dashboard

    Use pre-built apps and templates to set up your DORA dashboard and visualize DORA metrics.

  • Industry Standard Metrics

    Track the four key DORA metrics - Deployment Frequency, Lead Time for Changes, Change Failure Rate, and Time to Restore Service.

SetUpDORAMetricsDashboardwithGathr
  • Custom Metrics

    Define your own metrics, beyond DORA, to track DevOps progress and make informed decisions.

  • Traceability

    Seamlessly trace issues across the DevOps lifecycle to identify bottlenecks and troubleshoot issues.

  • Proactive Response

    Enable faster feedback loops to continuously improve user experience.

EnsureContinuousDevOpsMonitoring

Integrations

Expert Opinion

Approved by the
industry experts

Gathr has the stamp of approval from leading analysts and market experts.

MEET GATHR

Gen AI powered, no-code, unified
data-to-outcome platform

  • No-code for data at scale, batch and streaming
  • Gen AI help to search, understand, query, and build easily
  • 250+ connectors,
    200+ operators,
    50+ apps and
    Solution blueprints
  • Unified collaborative experience
  • Best of open source and enterprise grade
  • Production ready output from day 1

Capabilities

Why Gathr

Ten Reasons to upgrade to Gathr

No code for data at scale

When it comes to data processing, data analysis, and data management, there are many no-code tools; however, their capabilities only address fragments of the data journey, and cannot deal with the complexities of data at scale. On the other hand, there are tools that support data at scale, but they are often complex, demand a steep learning curve, and require significant coding efforts. Gathr stands alone as the only platform that supports no-code application development for data at scale.

All-in-one unified platform

Say goodbye to the challenges of managing multiple tools and product suites. Gathr unifies data integration, data quality, machine learning, action-based visualization, and process automation into a seamless, all-in-one platform. A unified user experience allows you to effortlessly stitch end-to-end ‘data to outcome’ business apps across these capabilities. Moreover, a host of ready-to-use business apps for DevOps, FinOps, CloudOps, SecOps, and more, are available out of the box.

ML at the front and center

Gathr offers enterprise-grade ML and MLOps capabilities such as drag-and-drop ML, model training and tuning, drift detection, model management, and more. The platform streamlines the entire ML lifecycle for teams to either build or bring in their own model and operationalize the models quickly, at scale. Seamlessly use ML in-line within your pipelines and apps to improve data quality and power advanced analytics. Moreover, several out-of-the-box apps come with built-in ML capabilities for anomaly detection, predictions, recommendations, etc.

Industry-leading real-time capabilities

Gathr stands at the forefront of streaming analytics, enabling seamless processing, analysis, and instant action on streaming data. With unmatched scalability, integration with diverse streaming sources, and robust complex event processing, Gathr sets the standard. Low-latency data transformation, ML integration, alerts, and visualization tools, make it the go-to solution for real-time enterprise use cases. Year after year recognition by Gartner and Forrester reaffirms Gathr's leadership in this space.

Self-service fueled productivity

Teams with varying skills can effortlessly build, deploy, and manage data pipelines and applications in minutes with Gathr's intuitive self-service drag-and-drop UI. Without the code-level complexities and lesser maintenance hassles with point-and-click troubleshooting, Gathr significantly boosts your teams' productivity. With over 250 connectors, 200 transformations, and 100 ML algorithms, available out of the box, Gathr turbocharges your application development. Plus, our library of 100+ ready-to-use business apps propels your data-driven journey into overdrive.

Collaborative innovation unleashed

Break silos and foster real-time collaboration between data stewards, data engineers, data scientists, DevOps engineers, business analysts, and business users. Not only Gathr ensures smooth handoff between data stewards and data engineering teams, but also streamlines version control, movement of pipelines from dev to prod, end-to-end monitoring, debugging, and more to simplify DevOps. Though the platform is designed for unhindered collaboration and productivity, its role-based access control, encryption, and other enterprise-grade security features ensure data integrity and security at all times.

Automation baked throughout

Simplify and speed up pipeline creation with no-code application development, and features like auto schema detection, auto pipeline inspection, auto data validation, and more. Employ fully automated data pipelines for ongoing database replication, data lake hydration, data cleansing, ML model tuning, etc. Gathr extends its automation power to your business processes, automating workflows, repetitive tasks and actions - freeing your team from mundane routines.

Enterprise-grade reliability & extensibility

While Gathr is built over an open architecture, it offers the quality, performance, stability, reliability, security, and support that enterprises require for their mission-critical operations. It means you get the power of the community with all its upgrades without the hassle of going through numerous forums to find answers for any technical issue. At the same time, Gathr's patented extensibility allows you to reuse pre-built and custom components across use cases and quickly extend your solutions. With these capabilities, you can ensure your enterprise remains nimble and future ready.

Interoperable across cloud vendors

Gathr supports key functionalities such as portability, interoperability, and platform-independency. With Gathr you can build applications once and deploy them on any other cloud in the future. No more cloud vendor lock-ins! You can easily move to a different cloud vendor in the future without experiencing issues such as application downtime, high costs, or technical incompatibilities.

Lowest TCO

Gathr offers more cost advantages than any other solution in its class. For enterprise users with On-Prem/VPC deployments, it costs less than the TCO of a skilled engineer. With its SaaS plans, you can create apps and experiment at no cost and pay only when you execute the app. You can get started quickly with the forever-free plan. As you grow and scale, enjoy the flexibility of pay-as-you-go pricing, with as little as $0.25/credit, that too after utilization of free credits. Moreover, you get 30% additional cost savings with the option to bring your own cloud (BYOC).

Learning and Insights

Stay ahead of the curve

FAQS

Find Your Answers

How DORA metrics help in assessing DevOps success?
While most organizations have embraced DevOps developing the right culture, establishing communication channels, and implementing advanced tools, they are still unable to assess the success of their DevOps initiatives. DevOps and engineering leaders recognize DORA metrics as a standard framework for measuring DevOps success. DORA metrics help them measure software delivery throughput (speed) and reliability (quality) accurately. By analyzing the DORA KPIs, teams can easily gain insights into performance trends, detect issues across different stages of DevOps, and take remedial actions to deliver better software, faster. For instance, by tracking deployment frequency, organizations can observe if their teams have improved over a period, remained consistent, or experienced extreme deviations. Similarly, a higher change failure rate can indicate issues with change management, quality testing, and more. With a DORA metrics dashboard, organizations can easily visualize DORA metrics, detect process bottlenecks, perform root cause analysis, and take action for continuous improvements in DevOps.
How can we measure business value with DORA metrics?
DORA metrics are a marker of software delivery throughput (speed) and reliability (quality), which eventually correlate with the delivery of higher end-user satisfaction and business value. However, organizations can track business value over a period based on certain focused and custom KPIs. For instance, the metric 'Innovation' can be defined as a function of every feature enhancement delivered to customers, excluding bugs. Tracking this metric can help businesses determine how much they have actually worked towards improving their product or service against removing its existing, lingering flaws. Similarly, Mean Time to Recover (MTTR), which is one of the 4 key DORA metrics, can provide insights into customer satisfaction. Such metrics and their trends over a period can offer organizations data-driven predictability and can be used as a business driver.
What are some common challenges teams face with their DORA dashboards?
Teams tend to misunderstand the purpose of their metrics and start using them as their goals, which is an anti-pattern as cited by Goodhart's Law - "When a measure becomes a target, it ceases to be a good measure." The metrics are the outcome of a team's performance; however, teams tend to game the system and shift their focus to improving their scores instead of real-world performance. Another major challenge with metrics is related to benchmarking; teams often lack awareness of what's a good deployment frequency in their context. Many times, the DORA dashboards are rigid and offer no clues as to what the metrics mean. For example, the DORA dashboard might indicate that the team deployed 200 times in a month but would not offer any insights into past trends or assess the lead time from request to delivery. Such dashboards offer limited flexibility in assessing the flow of deliveries and business value.
In addition to DORA metrics, what other metrics should we choose for end-to-end DevOps monitoring?
Selection of the right metrics can be a complex task. While the DORA metrics offer insights into the end performance of your DevOps practices, they can go only so far. For instance, DORA metrics alone cannot help you identify the bottlenecks in CI or answer why the software isn't always in a releasable state. You might need to track additional metrics to understand how long the branches exist, or how frequently the changes are made to the trunk, how many things are in progress, and so on. Additionally, organizations can measure defect volume and escape rate, failed deployments, change volume, unplanned work, and SLA compliance to get a more holistic view of their DevOps. Gathr can help you create a custom DevOps monitoring tool to meet these requirements.
How to avoid being misled by DevOps KPIs?
The selection of the right metrics is the most crucial step in the implementation and analysis of KPIs. For example, improvement in metrics like ‘lines of code’ and ‘number of defects fixed’ may give a false sense of comfort as they don’t necessarily translate to improvements in quality, productivity, and reliability. At times, it is seen that teams tend to focus on improving their scores and may lose sight of the business goals. For example, measuring the ratio of committed vs. completed features can force teams to prioritize schedules over quality. That’s why organizations need to find metrics that link directly to customer satisfaction and not just delivery goals.