Customers

Trusted by data and AI teams.
Across enterprises and startups.

Highlights

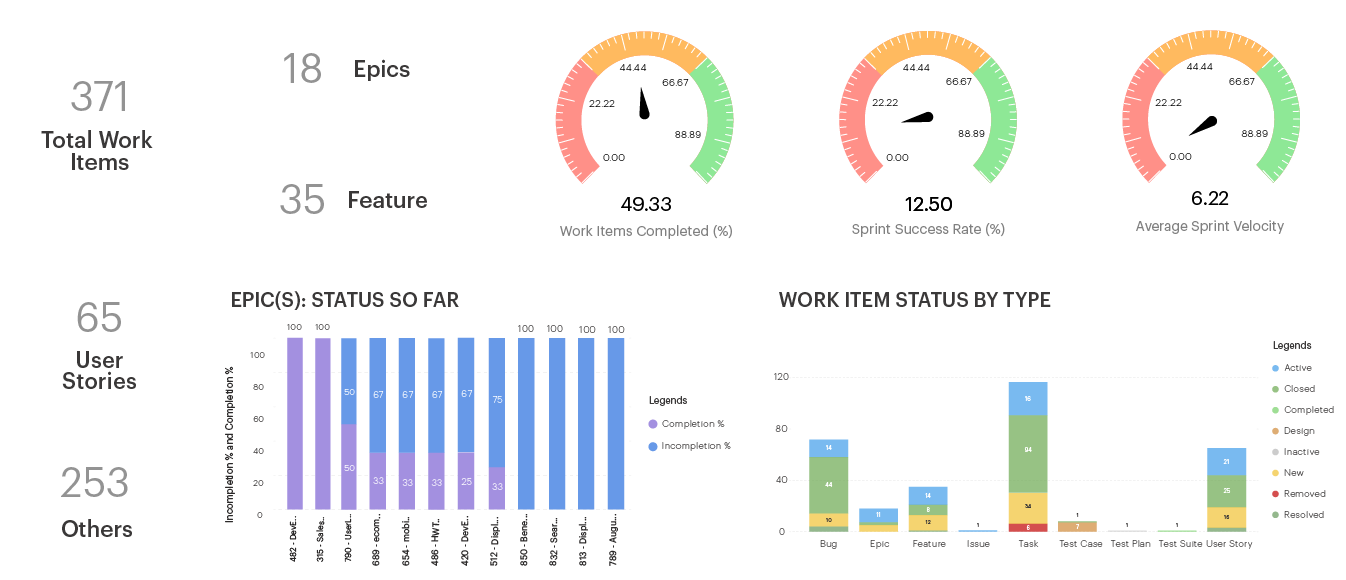
Monitor backlog and analyze your sprint velocity, lead time, build deployment trends, & more.

AgileMetrics

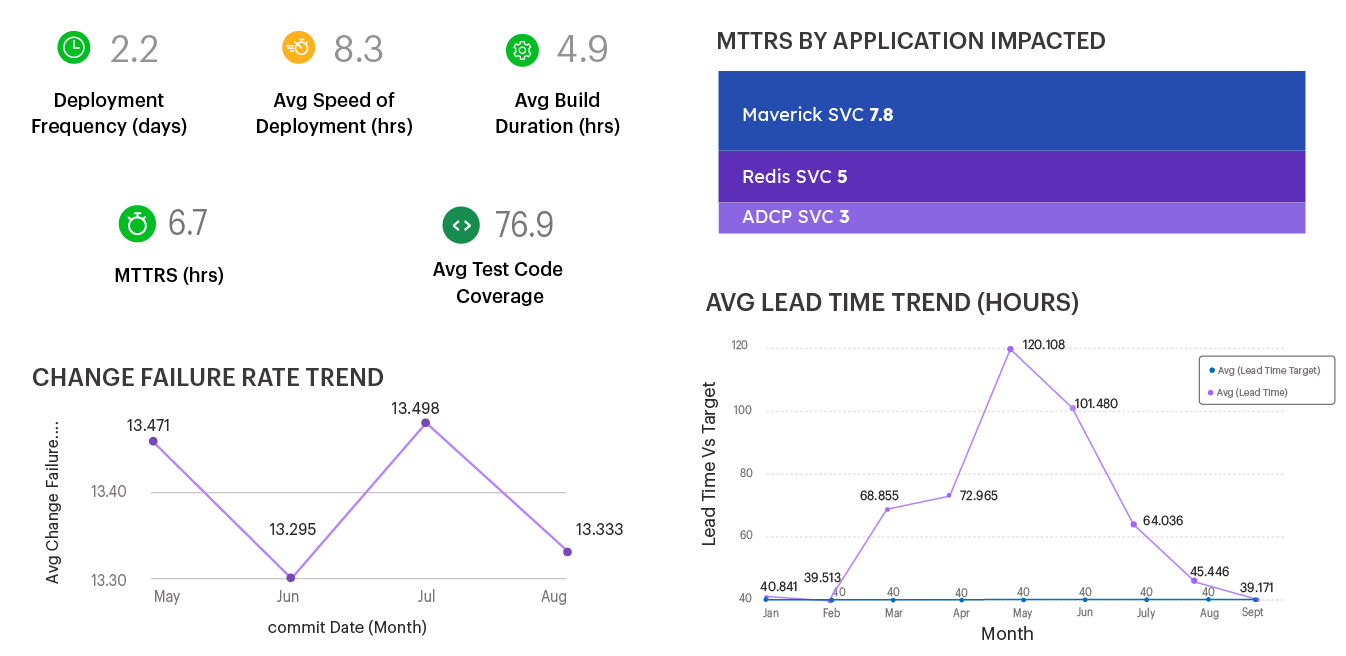
Track the four key DORA metrics - Deployment Frequency, Lead Time for Changes, Change Failure Rate, and Time to Restore Service.

DORAMetrics

Stay on top of your infrastructure as code (IaC) pipelines to ensure optimal infrastructure provisioning.

InfrastructureMetrics

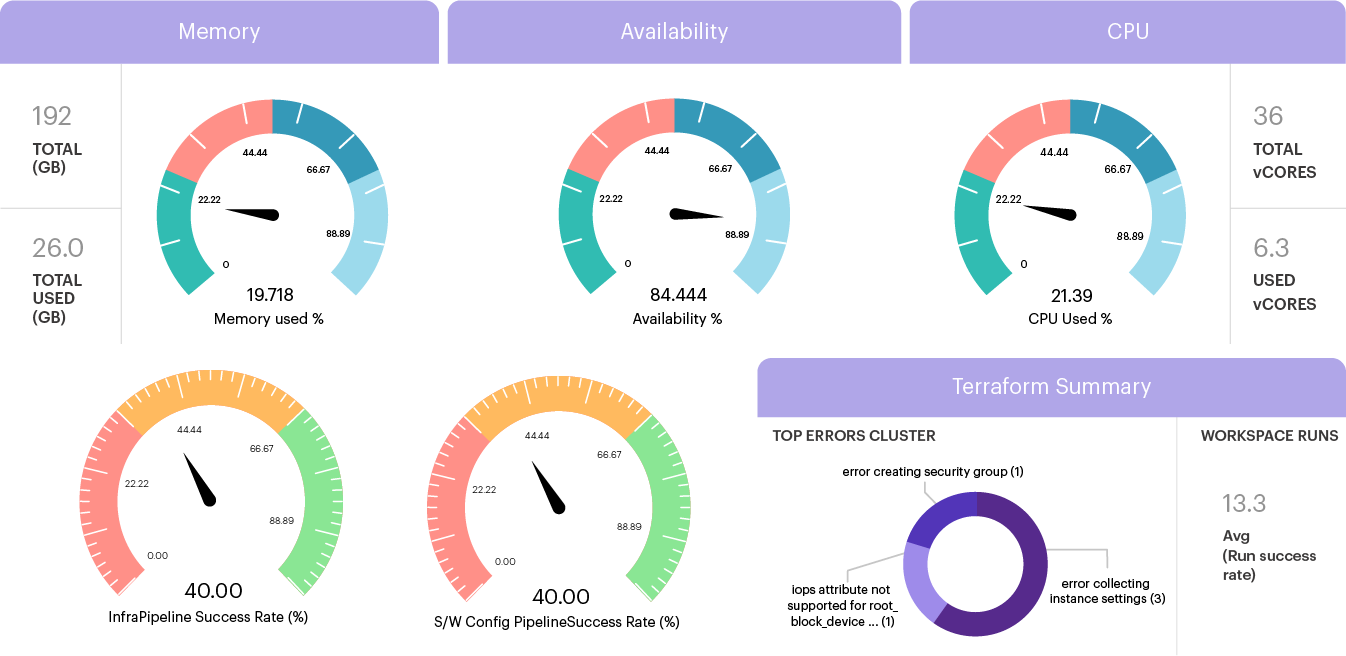
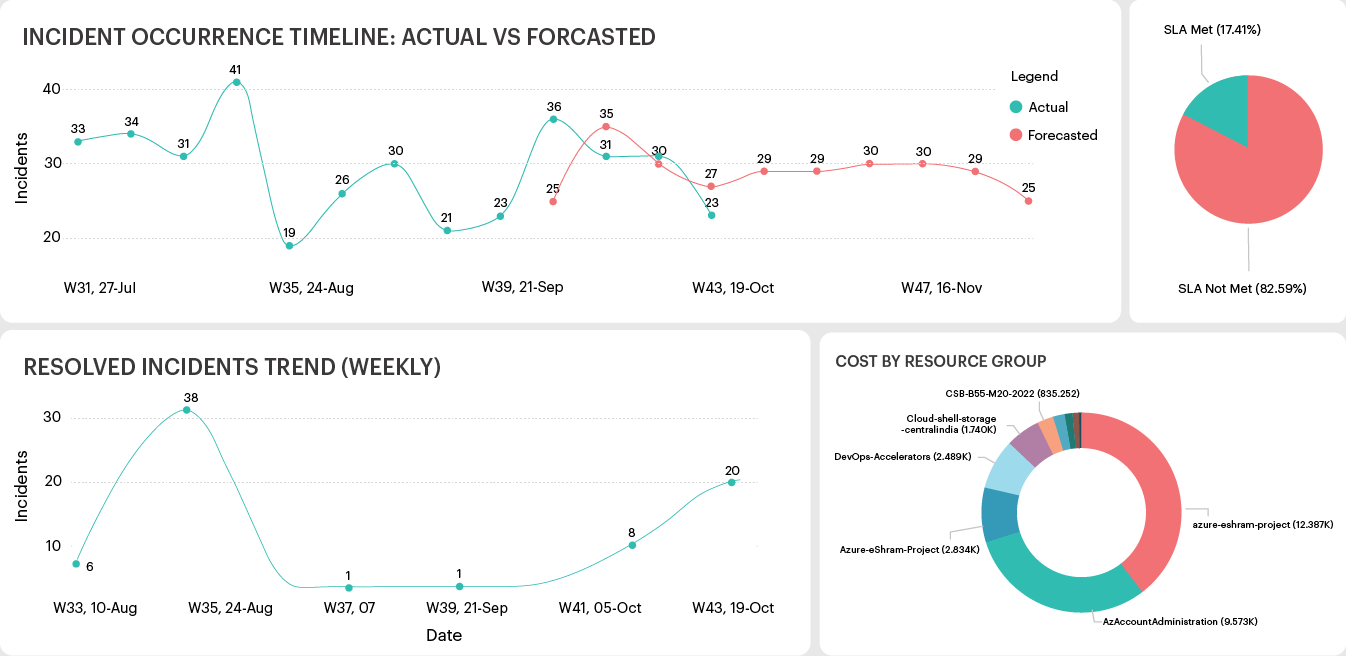
Get increased traceability to drill down and across cloud cost, security, incidents, and more.

OperationsMetrics

Advantages

50x

More frequent code deployments

100x

Faster lead time between committing and deploying

3x

Lower change failure rate

400x

Faster recovery from incidents

Where do you see yourself in the DevOps Adoption Curve?

White Paper

DevOps 360

A Guide to Continuous DevOps Improvements

Download Now

Solution Details

Unified DevOps 360

Optimize hybrid and multi-cloud resources with unified DevOps 360

  • Too Many Dashboards

    Getting a unified view of applications, their underlying infrastructure, and networks is difficult.

  • Disjointed Toolchains

    Evolving toolchains with frequent updates, integration, and data sync requirements complicate data analytics.

  • Lack of Actionable Intelligence

    Monitoring health and performance and correlating application issues with infrastructure and network bottlenecks is challenging.

DevOpsMonitoringChallenges
  • Quick Integration

    Use out-of-the-box connectors to eliminate time and effort in complex API integrations.

  • Unified Insights & Actions

    Get pre-built apps and templates to monitor applications, infrastructure, cloud security, platform availability, and more.

  • Higher Predictability

    Use Python scripts and machine learning for predictive analytics, ensuring proactive response and timely, high-quality deliveries.

EnableContinuousMonitoring
  • Quantify Insights

    Monitor key Agile, DORA, Infra as Code (IaC), and Operations metrics to stay on top of your applications and environment.

  • Gain 360 Visibility

    Get detailed DevOps dashboards to monitor cloud/infra, application, platform, builds and deployments, incidents, & more.

  • Accelerate Troubleshooting

    Correlate application performance with infrastructure issues and bottlenecks to expedite root cause analysis and issue resolution.

ExperienceDevOps360

Integrations

Expert Opinion

Approved by the
industry experts

Gathr has the stamp of approval from leading analysts and market experts.

MEET GATHR

Gen AI powered, no-code, unified
data-to-outcome platform

  • No-code for data at scale, batch and streaming
  • Gen AI help to search, understand, query, and build easily
  • 250+ connectors,
    200+ operators,
    50+ apps and
    Solution blueprints
  • Unified collaborative experience
  • Best of open source and enterprise grade
  • Production ready output from day 1

Capabilities

Why Gathr

Ten Reasons to upgrade to Gathr

No code for data at scale

When it comes to data processing, data analysis, and data management, there are many no-code tools; however, their capabilities only address fragments of the data journey, and cannot deal with the complexities of data at scale. On the other hand, there are tools that support data at scale, but they are often complex, demand a steep learning curve, and require significant coding efforts. Gathr stands alone as the only platform that supports no-code application development for data at scale.

All-in-one unified platform

Say goodbye to the challenges of managing multiple tools and product suites. Gathr unifies data integration, data quality, machine learning, action-based visualization, and process automation into a seamless, all-in-one platform. A unified user experience allows you to effortlessly stitch end-to-end ‘data to outcome’ business apps across these capabilities. Moreover, a host of ready-to-use business apps for DevOps, FinOps, CloudOps, SecOps, and more, are available out of the box.

ML at the front and center

Gathr offers enterprise-grade ML and MLOps capabilities such as drag-and-drop ML, model training and tuning, drift detection, model management, and more. The platform streamlines the entire ML lifecycle for teams to either build or bring in their own model and operationalize the models quickly, at scale. Seamlessly use ML in-line within your pipelines and apps to improve data quality and power advanced analytics. Moreover, several out-of-the-box apps come with built-in ML capabilities for anomaly detection, predictions, recommendations, etc.

Industry-leading real-time capabilities

Gathr stands at the forefront of streaming analytics, enabling seamless processing, analysis, and instant action on streaming data. With unmatched scalability, integration with diverse streaming sources, and robust complex event processing, Gathr sets the standard. Low-latency data transformation, ML integration, alerts, and visualization tools, make it the go-to solution for real-time enterprise use cases. Year after year recognition by Gartner and Forrester reaffirms Gathr's leadership in this space.

Self-service fueled productivity

Teams with varying skills can effortlessly build, deploy, and manage data pipelines and applications in minutes with Gathr's intuitive self-service drag-and-drop UI. Without the code-level complexities and lesser maintenance hassles with point-and-click troubleshooting, Gathr significantly boosts your teams' productivity. With over 250 connectors, 200 transformations, and 100 ML algorithms, available out of the box, Gathr turbocharges your application development. Plus, our library of 100+ ready-to-use business apps propels your data-driven journey into overdrive.

Collaborative innovation unleashed

Break silos and foster real-time collaboration between data stewards, data engineers, data scientists, DevOps engineers, business analysts, and business users. Not only Gathr ensures smooth handoff between data stewards and data engineering teams, but also streamlines version control, movement of pipelines from dev to prod, end-to-end monitoring, debugging, and more to simplify DevOps. Though the platform is designed for unhindered collaboration and productivity, its role-based access control, encryption, and other enterprise-grade security features ensure data integrity and security at all times.

Automation baked throughout

Simplify and speed up pipeline creation with no-code application development, and features like auto schema detection, auto pipeline inspection, auto data validation, and more. Employ fully automated data pipelines for ongoing database replication, data lake hydration, data cleansing, ML model tuning, etc. Gathr extends its automation power to your business processes, automating workflows, repetitive tasks and actions - freeing your team from mundane routines.

Enterprise-grade reliability & extensibility

While Gathr is built over an open architecture, it offers the quality, performance, stability, reliability, security, and support that enterprises require for their mission-critical operations. It means you get the power of the community with all its upgrades without the hassle of going through numerous forums to find answers for any technical issue. At the same time, Gathr's patented extensibility allows you to reuse pre-built and custom components across use cases and quickly extend your solutions. With these capabilities, you can ensure your enterprise remains nimble and future ready.

Interoperable across cloud vendors

Gathr supports key functionalities such as portability, interoperability, and platform-independency. With Gathr you can build applications once and deploy them on any other cloud in the future. No more cloud vendor lock-ins! You can easily move to a different cloud vendor in the future without experiencing issues such as application downtime, high costs, or technical incompatibilities.

Lowest TCO

Gathr offers more cost advantages than any other solution in its class. For enterprise users with On-Prem/VPC deployments, it costs less than the TCO of a skilled engineer. With its SaaS plans, you can create apps and experiment at no cost and pay only when you execute the app. You can get started quickly with the forever-free plan. As you grow and scale, enjoy the flexibility of pay-as-you-go pricing, with as little as $0.25/credit, that too after utilization of free credits. Moreover, you get 30% additional cost savings with the option to bring your own cloud (BYOC).

Learning and Insights

Stay ahead of the curve

FAQS

Find Your Answers

What is continuous monitoring in DevOps?
Continuous monitoring is a monitoring approach that focuses on increased automation and integration of tools to unify data, metrics, and insights around application performance, security threats and vulnerabilities, compliance risks, user experience, and more. It essentially integrates application, infrastructure, and network monitoring. Continuous monitoring can help DevOps teams detect and resolve application issues quickly, avoid unplanned outages, and meet their performance targets as well as business goals effectively.
How to enable continuous monitoring in DevOps?

Continuous monitoring in theory involves monitoring the health, performance, and reliability of both your application and infrastructure components across development and production. As every cloud service provider offers its own monitoring solution, DevOps teams often have to track different dashboards to ensure continuous monitoring. Controlling virtual sprawl and costs, and ensuring every application component is compliant, secure, and available becomes challenging due to the lack of unified monitoring. That’s why it is recommended to gather all your data from the application and its underlying network and infrastructure in one place for continuous monitoring in DevOps. This data can include:

  • Throughput
  • Browser speed
  • SLA status
  • CPU, Storage, & Disk Usage
  • Server Availability/ Uptime Trends
  • Mean Time to Restore (MTTR) & other response times
  • Latency
  • Diagnostics logs & insights
  • Container insights, and more

It is important to note here that data from a single source can only tell so much; it is important to correlate data from different sources to troubleshoot issues or find opportunities for continuous improvement. In this respect, teams need to visualize their data, should have the ability to easily slice and dice the data, define their own formulas and thresholds for alerts, establish quality gates, and derive contextual insights from plain text data. Gathr makes all this simple with its DevOps 360 solution.

What are the primary benefits of continuous monitoring?

Here are some of the benefits of continuous monitoring in DevOps:

Enhanced Operations: With automated data collection and streamlined end-to-end visibility, teams can collaborate better to detect and mitigate security and performance issues.

Proactive Response: With unified visibility, teams can configure more accurate threshold and event-based alerts to respond quickly and troubleshoot issues before they snowball into a major outage.

Cost Savings: Teams can analyze resource consumption data over a period to detect cyclic trends and over-provisioning/under-provisioning issues. It can allow organizations to ensure the most efficient usage of resources (CPU, RAM, etc.).

Better End User Experience: With timely, hiccup-free deliveries and quicker resolution of performance issues, users get a better application experience.

How to set up a DevOps monitoring dashboard?
Today, teams rely on different dashboards to monitor their applications and the underlying infrastructure. Hybrid or multi-cloud environments add to the complexity. Teams need to set up various dashboards using Elastic Search, Logstash, Grafana, Nagios, Prometheus, CloudWatch, etc. to monitor different aspects of applications and the environment. However, it’s not always simple to gather data and configure dashboards that provide actionable intelligence. Hence, it’s important to define monitoring goals, select the right KPIs, and shortlist a scalable and flexible monitoring solution that can simplify search, filtering, visualization, and analytics. You can classify data and insights into different segments such as server status and health, security and vulnerability trends, resource consumption and costs, development milestones, user experience, and more.
How to automate DevOps KPI capturing and analysis?
To automate data capturing and synchronization across your DevOps environment, you need to ensure that all tasks and tools across your environment are well integrated and orchestrated. These integrations can get complex, posing several restrictions, and requiring frequent updates. Gathr takes care of all such integration complexities with its bi-directional connectors that pave the way for automated insights delivery. bi-directional connectors