
BLOG
SPACE metrics – Why they matter & how to get started
What are SPACE Metrics?
SPACE metrics framework, as published in the paper by researchers at GitHub, the University of Victoria, and Microsoft, provides a new approach to define, measure, and predict developer productivity. SPACE is an acronym for satisfaction, performance, activity, communication, and efficiency. While there is a wide range of metrics available to measure each dimension of developer productivity, the researchers suggest that organizations should carefully select the metrics as per their context and apply them at the individual, team, function, or group level.

What’s wrong with the traditional developer productivity metrics?
There have been many attempts to measure developer productivity in the past; however, organizations rarely get it right. Developers’ work often requires long hours of research, log analysis, finding bugs, and, mostly, staring at the screen. All this can’t be measured with a single metric. That’s why measuring the activity volume with lines or code, the number of commits or even code changes (lines added/deleted) can only tell so much. Many times, the increased activity volume is a false positive, as it’s rarely because of any spike in productivity but mostly a result of last-minute PR approvals and issue resolutions, which in turn could be caused by a critical deadline. Such patterns are practically a more accurate indicator of poor planning, developer burnout, and discontent. On the other hand, there’s a slight chance that the increase in activity volumes results from improvements in the toolchain, collaboration, and communication. However, with the traditional metrics alone, one can’t tell the difference.
How do SPACE metrics provide a better approach to measuring developer productivity?
The hint is in the name – SPACE (satisfaction, performance, activity, communication, and efficiency). SPACE metrics allow the measurement of every dimension of developer productivity with both qualitative and quantitative approaches.
We have described the SPACE metrics in detail with tips to improve and act on these metrics for continuous improvements in developer productivity below:
Satisfaction & Wellbeing
What to measure?
- Developer satisfaction: Gauge developers’ opinions and feelings about the code review process, CI/CD pipeline, workloads, and their willingness to recommend the team to others with periodic surveys.
- Efficacy:Assess if they have the right and enough tools to perform their jobs efficiently.
- Burnout:Use quantitative measures to assess workloads. Longer work hours or inconsistent late-night hours could also indicate potential burnout.
You can conduct your developer satisfaction surveys on Klera. It offers an easy solution for conducting employee satisfaction surveys with a form-based survey builder, auto-scheduling, and advanced response analysis capabilities.
How to improve?
- Workflow automation: Reduce manual workloads and handoffs
- Toolchain integration: Avoid data inconsistencies across tools with increased data synchronization and integration; it not only reduces swivel chair work but also the chances of errors and rework.
- Data centralization: Reduce conflicts, improve prioritization, and create a single source of truth for requirements, issues, bugs, and more. Klera’s unified product backlog is purpose-built to meet these requirements.
- Team rotation: Rotate work responsibilities (peer reviews, bug fixes, etc.) to prevent monotony.
- Survey response analysis: Analyze survey responses along with the telemetry data to gain insights into developer productivity, gauge problematic patterns (e.g., Hero Anti-pattern), and proactively resolve issues.>
You can learn more about the correlation between developer happiness and productivity and ways to improve in our e-book – Strive for Developer Happiness, Productivity will Follow.
Performance
What to measure?
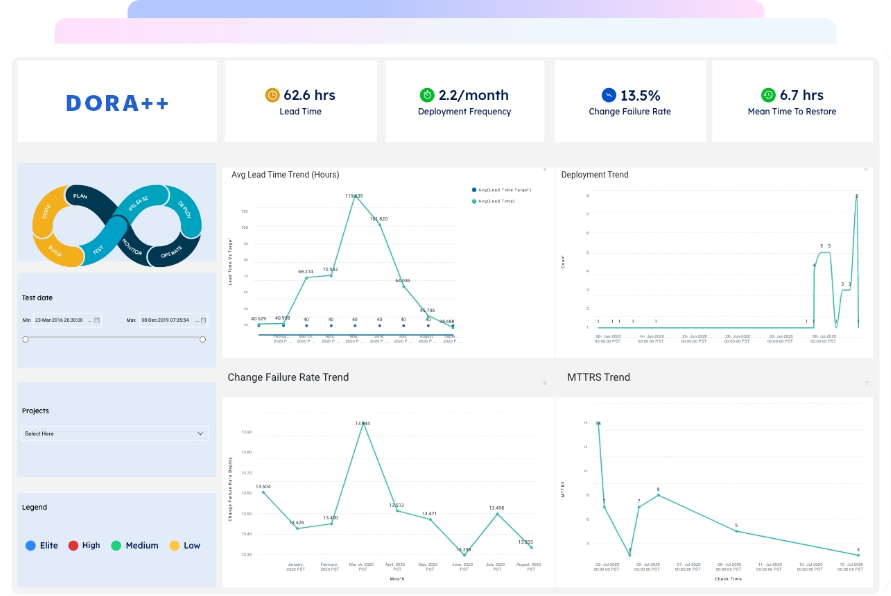
- DORA metrics: The four key DORA metrics, viz. mean lead time, deployment frequency, change failure rate, and mean time to restore (MTTR), provide a good starting point to get a sense of performance. Additionally, operational performance and reliability metrics (availability, latency, errors, SLOs, etc.) are also accurate makers of performance. These metrics provide good visibility into the velocity and quality parameters of developer performance.
- Business outcomes: The researchers caution against measuring individual performance as software development is a team activity. Increased lines of code or a higher volume of work can come at the cost of quality. Again, high-quality work can prove to be redundant due to misaligned features or lack of market requirements. Features leading to customer delight may not translate to business profits. Instead, organizations should focus on measuring outcomes such as customer satisfaction, NPS scores, feature or product adoption, cost reductions, customer retention, and more.
How to improve?
- Implement CI/CD best practices: Implementing trunk-based development, breaking down a project into smaller tasks or batches, test automation, automated CI/CD pipeline monitoring, etc., can help achieve continuous improvements in performance.
- Improve observability: Enable continuous monitoring in DevOps. Track applications, their underlying infrastructure, and their platform to gauge performance trends and find optimization opportunities.
- Automated governance: It can help you accelerate the progress of work items along a pipeline with requisite quality gates, compliances, and security checks. Explore Klera’s out-of-the-box app for automated governance.
Activity
What to measure?
- Design and development: Work items, pull requests, commits, code changes (lines added/deleted), issue distribution by projects/teams/ components/contributors.
- CI/CD: Number of builds, test cases, test automation, deployments/releases, infrastructure utilization.
- Operations: Number of incidents/issues, open vs. closed tickets, issue distribution by severity, on-call participation.
How to improve?
- Data-driven project planning: Improve integration across tools to stay on top of your project data for effective PI planning. Centralize all your planning activities, including creating new issues, releases, and moving backlog issues from past to current PI. It helps with better identification of date and workload conflicts and project dependencies.
- Unified analytics: Leverage advanced visualization and analytics for predictive deliveries. Track workloads and activity volumes to identify risks (deviations from delivery schedules) and re-allocate resources and budgets accordingly to meet timelines.
It is important to note here that measuring everything to assess activity volumes is neither feasible nor recommended. As we have discussed earlier, developers spend a lot of time on ad-hoc activities or helping other team members with tips and guidance – things that are hard to track and measure. The idea of measuring activity volumes is to gauge trends and patterns to identify any major bottlenecks rather than pinpoint individuals for their work. The insights into the team and individual productivity can be accurate only when the activity volumes are combined and analyzed along with data from other productivity dimensions, as suggested in the SPACE metrics framework.
Communication and Collaboration
What to measure?
- Communication and collaboration: Assess the ease of collaboration with periodic surveys to identify major issues with the toolchain, processes, and teams. The survey should throw light on whether the team members get sufficient and timely feedback, are their inputs well-received or acknowledged in meetings, and do they have procedures and tools to support collaboration and more.
- PR comments: Keep track of PR comments (unresolved or active comments) or PRs with no comments. Teams not following proper commenting and PR policies may require attention.
- Messaging data: Tools like Slack offer analytics dashboards to track active members, count of calls/messages, and more.
- Enterprise search trends: It is useful to track the top searched resources and pages to improve their access and quality. Enterprise search trends detailing user activity across internal pages and their activity paths, devices, browsers, etc., can help you improve access to critical resources and improve sharing and collaboration among teams.
How to improve?
- Automated workflows: Automate approval workflows and reduce dependence on email follow-ups to ensure relevant stakeholders are involved at the right stages for seamless collaboration.
- Seamless feedback loop: Communication tools like Slack, Teams, PagerDuty, etc., can be integrated with GitHub, Jenkins, Travis, and other CI tools, which can help teams get notifications on build pushes and commits, enabling timely comments, reviews, and feedback.
- Training and workshops: Conduct training to address communication gaps and reinforce collaboration best practices, document tribal knowledge, and more.
Efficiency & Flow
What to measure?
- Maker time: It is important to consider maker vs. manager schedules to understand and measure developer productivity better. Higher context switching is detrimental to development productivity. Frequent interruptions tracked via Slack, email, and communications tools and meetings in a developer’s schedule cut their “making” time, reducing their efficiency and flow.
- DORA metrics: Metrics such as deployment frequency and the lead time for changes can provide a good overview of efficiency and flow.
How to improve?
- Workflow automation: Automate routine tasks to reduce frequent interruptions.
- Advanced alerting: Prevent duplicate tickets and alerts for a single issue/incident, increase alert specificity, add tiers (severity/priority), and make alerts actionable with better context (description, links, etc.).
- Reduce rework: Increase process compliance to cut avoidable mistakes and oversights. Automate security/vulnerability scans earlier in the CI/CD pipeline to ensure developers aren’t working on a vulnerable code and reduce the time spent on fixing bugs.
Next Steps
The SPACE metrics framework provides a well-defined approach to measuring developer productivity. However, most organizations already have systems and metrics with varying levels of overlap with the framework. The need is to take guidance and align current practices to adopt the framework for a more holistic view of developer productivity. Klera can help you get started with SPACE metrics implementation to boost developer productivity.

Table of Contents
XOPS APPS BY GATHR
DevOps Apps
DORA++, DevOps360, & more
Boost your DevOps health and performance by simplifying application planning, development, delivery, and operations stages.
-
DORA++
-
DEVOPS 360
-
VULNERABILITY ANALYSIS
-
CONTINUOUS COMPLIANCE
-
DEVOPS TRACEABILITY
-
CI/CD PIPELINE MONITORING
-
CODE LEAK ANALYSIS
Recent Posts
View more postsBlog

Blog

Blog

Blog
