While DevOps has provided a middle path to the warring development and operations tribes in most organizations, it requires a high level of expertise to champion CI/CD processes and achieve continuous improvements. Organizations often struggle to harness the true value of their CI/CD implementation. Though CI/CD pipeline monitoring can help in assessing the health and performance of pipelines, selecting the right tool for monitoring isn’t simple. They also face the quintessential build vs. buy dilemma in the selection of CI/CD monitoring tools. Like always, it’s not just about time and material; they also need to consider the total cost of ownership (TCO), along with the opportunity costs due to engagement of their resources in configuration and maintenance, instead of real work.
Let’s explore what it takes to monitor a CI/CD pipeline with and without a commercial monitoring solution.
The Build vs. Buy Approach
Navigating the Ever-Evolving Landscape of CI/CD Tools

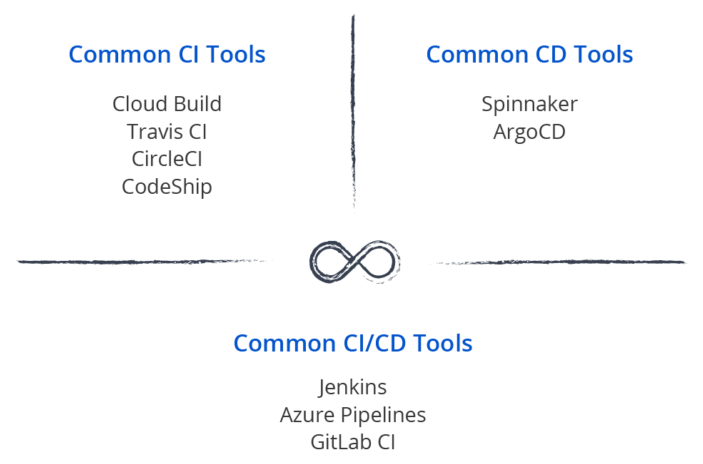
There are several players in the CI/CD space and every organization differs in its toolchain
Involving different tools for source code management, build automation, test automation (unit tests, integration tests), deployment, and monitoring. However, it’s not safe to think that CI/CD implementation is a one-time effort. Organizations in their CI/CD journey need to update or adopt new tools and platforms, and also, discard previous tools to continue “shift left” and increase automation. This means, every time an organization makes a change to its CI/CD setup, it has to revisit its monitoring. It might require additional integration and instrumentation efforts.
Organizations need to carefully evaluate these iterative costs and efforts involved in a self-configured monitoring setup against the commercial monitoring tools that offer ready integration with the existing and upcoming CI/CD tools in the market.
Facing the Challenges Within Jenkins
It is important to mention Jenkins here, as it is the oldest and most popular tool for CI with a market share of more than 50%. It offers 1500+ community-backed plugins that help in extending its functionalities. However, people who have worked on Jenkins realize that its support and administration is not an easy task. Many times, when organizations onboard more teams on Jenkins, they struggle to maintain the speed and quality of software delivery. It is usually because as workloads grow and toolchains diversify, additional plugins are required for stable pipeline operations. It’s a herculean task to monitor plugin dependencies and vulnerabilities, and upgrade Jenkins from time to time. For instance, a quick search shows around 10 monitoring plugins in the Jenkins plugin repository, with at least one of them also carrying a vulnerability (at the time of writing of this article). Organizations need to ensure that their monitoring solution captures and provides alerts for such plugin vulnerabilities. Further, many times, teams have to search through numerous posts in forums to find a resolution for their problems.
While there is a constant overhead with any Jenkins CI implementation, organizations need to ensure that their monitoring setup is not elevating the issues further. They can rely on their commercial solution vendor to provide technical support, integrate vulnerability scanners, and help in dealing with upgrade issues in a timely manner.
Diving into the Open-Source Sea
Organizations who have made up their mind to dive into the open-source sea often end up shortlisting the ELK stack (Elasticsearch, Logstash, Kibana) for their monitoring requirements. It is well documented (here, here, and here) that open-source ELK is not necessarily without its costs. In any case, to monitor CI/CD pipelines with ELK, organizations not only need dedicated infrastructure (either self-hosted or cloud-based) but also need expertise for designing such a setup. At times, they have to start their R&D from scratch with community posts like these, which offer limited help. While there is enough documentation available on ELK, organizations also need to consider the possibility of using Grafana in place of Kibana, as some community posts suggest that it’s better for monitoring use cases. Ultimately, the success of open source monitoring depends largely on the team’s knowledge and expertise in configuring and implementing the solution.
The commercial vendor may or may not rely on ELK for monitoring. However, using their solutions, organizations do not need to concern themselves with the underlying technologies for data collection, analytics, insights, alerts, and reporting. Again the major advantage with a commercial monitoring solution is that it can help prevent time and effort in setup and issue resolution, as vendors offer committed technical support instead of leaving their customers to the community guidance.
Implementing the Right Metrics & Dashboards
Monitoring of a CI/CD pipeline hinges on choosing and tracking the right metrics. However, it is seen that in most organizations, metrics and dashboards are created by teams based on their past experience and technology exposure. For instance, people from network operations centers (NOCs) have an affinity for red, green, amber indicators, which provide much-needed abstraction from the underlying complexities of the network infrastructure. While such dashboards are useful for managing a large number of servers, implementing them in the CI/CD space might not be that useful. In fact, the “watermelon dashboards” can sometimes also give a false sense of comfort. Organizations might need more context to drill down and should be able to define custom metrics.
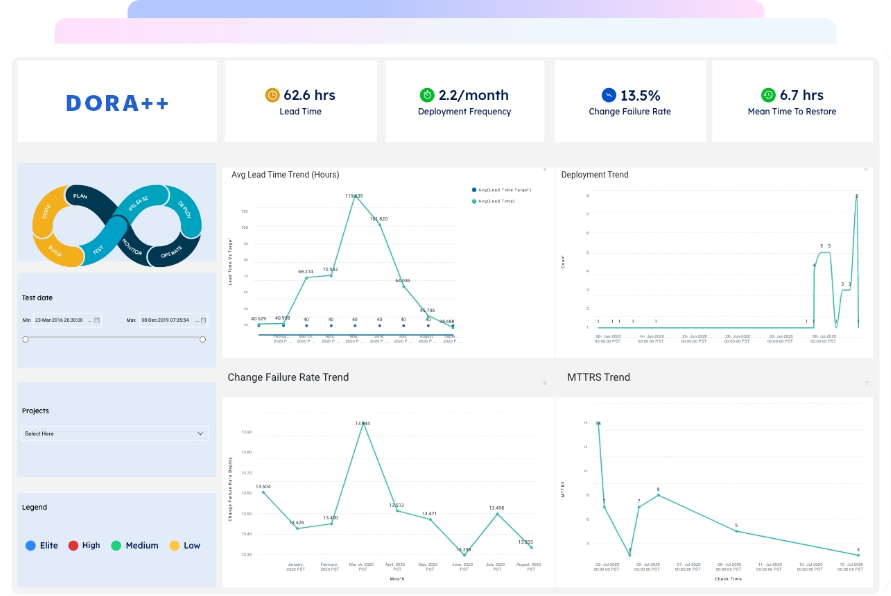
Further, as discussed earlier, they should be able to create new dashboards within minutes depending on the changes within their CI/CD setup. They should look forward to tracking the 4 key DevOps metrics: change lead time, deployment frequency, mean time to recovery, and change failure rate. While these metrics, first put forward by the DevOps Research and Assessment (DORA) group, are taken as gospel for tracking DevOps success, many enterprises have a hard time getting started. Watch our webinar to understand the challenges and pitfalls in implementing these metrics. Commercial vendors are likely to offer standard metrics and dashboards out-of-the-box with options to customize the metrics and dashboards. However, this is a critical criterion, and organizations should evaluate the effort involved in customization, avoiding complex monitoring tools with a long learning curve.
Summarizing the Benefits of Buy Approach
In contrast with the build approach, the buy approach provides the opportunity to rely on the expertise of commercial vendors, who offer out-of-the-box apps and custom solutions for monitoring. The approach not only saves organizations from reinventing the wheel but also helps them adopt the best practices easily. Further, it saves time and effort in numerous technical considerations (as discussed in the article above), which can lead to decision paralysis. Organizations can also consult with the vendors and run proof-of-concepts (POCs) to get the best possible monitoring solution for their CI/CD setup. Today, most vendors support both on-premise and cloud-based options for CI/CD pipeline monitoring. This flexibility allows organizations to choose a deployment model as per their requirements or get the best of both worlds, with hybrid implementations. Organizations can also rely on their SLAs with vendors to meet their requirements of high availability and uninterrupted operations. Last but not least, commercial vendors offer dedicated support to resolve technical issues, carry out routine upgrades, and assist organizations in their complex configuration challenges.
How Gathr Simplifies CI/CD Pipeline Monitoring
Gathr offers bi-directional connectors to bring data from tools like Git, Jenkins, Sonar, and Artifactory together for analysis. Depending on their CI/CD setup, organizations can also gather data from other tools in their pipeline or extend the monitoring to include application monitoring (Nagios) and container monitoring (Kubernetes) without writing a single line of code. The data from the pipeline can be visualized to monitor the health of the CI/CD build pipelines and assess the performance and quality of deployments. Organizations set up intelligent alerts and actions to improve proactive response. Gathr also offers monitoring of DevOps DORA metrics with options to include custom metrics. Further, Gathr provides an easy approach to traceability, which helps in assessing which feature roll-out led to defects in production and what was its code impact. Learn more about these solutions here.


