BLOG
Observability – Here’s all you need to know
Introduction
In recent times, observability has quickly become a hot topic of discussion among IT practitioners, cybersecurity experts, analysts, and IT vendors who claim to offer solutions around it.
What is Observability?
The origin of the term observability can be traced back to control theory, where it refers to the capability to measure the internal states of a system by observing its external outputs. The concept, when applied to IT and software development, allows businesses to predict and resolve routine and unprecedented issues with contextual data and insights.
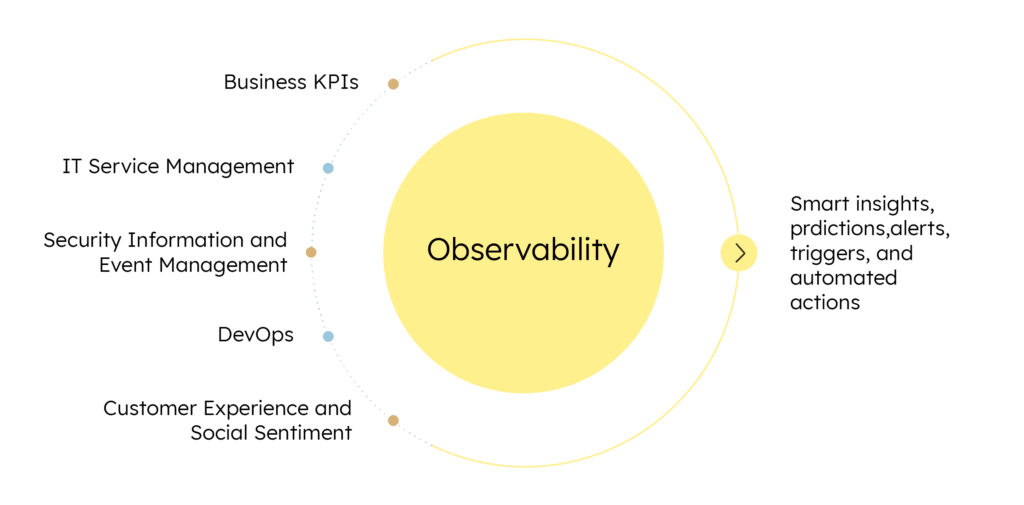
The scope of observability extends across business functions, converging data related to application performance, infrastructure availability, digital experience, business KPIs, customer experience, social sentiment, and more. The solutions enabling observability focus on correlating all such data, detecting dependencies, understanding system behavior and patterns, making predictions, and offering data-driven recommendations.
We will discuss the current landscape of observability and why and how organizations should move beyond the buzz, taking the first steps towards implementing observability.
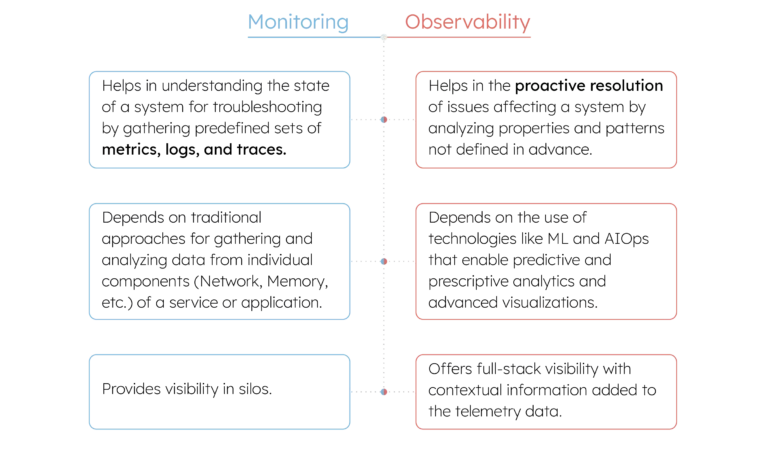
Difference Between Monitoring and Observability
It is important to note here that observability is not just another buzzword for IT infrastructure and application performance monitoring. Here are some major differences between monitoring and observability:
Why Do Organizations Need Observability?
Over the last couple of decades, businesses have increasingly adopted mobile and cloud-driven platforms, infrastructure, and services to deliver value to their customers. From monolithic software, which used to reside mostly on-premises, to centralized cloud computing that we rely on heavily today, and now the advent of IoT and edge-computing, software applications have evolved significantly in terms of their underlying architectures, deployments, and development methodologies. As a result of these developments, ensuring that a software application performs well requires continuous monitoring of different aspects of infrastructure and application components.
This is why IT operations departments responsible for supporting business applications in the past have also added new capabilities to support modern cloud-native, containerized applications, which rely on numerous third-party APIs, micro-services, and libraries. Nonetheless, the monitoring of applications in hybrid and multi-cloud environments has become a complex challenge. At present, organizations have numerous dashboards for tracking different aspects of an application, mostly with open-source solutions that are difficult to configure and integrate.
Organizations have tried gathering data across tools to create unified monitoring dashboards and alert mechanisms with varying degrees of success. Still, it is not rare for them to encounter previously unknown issues or events for which they have little or no preparedness. The biggest challenge is that such issues usually occur during peak load times when they have to respond fast while struggling to detect the root cause from their dashboards, which might not show the problem at all. This is perplexing for operations teams as the application experience reported by end-users via customer care and social channels contradicts what they monitor on their dashboards.
Have You Also Experienced the Watermelon Effect?
The watermelon – green on the outside, red inside – is used as an analogy to refer to the dashboards or metrics, which provide a false sense of comfort. IT/DevOps teams and site reliability engineers often experience this effect when their dashboards appear all green, even as their customer support teams get overburdened with customer complaints around failed orders, deliveries, billing, and more.
A common scenario is a large-scale website showing 99% availability, which is favorable for a business as long the 1% failure rate is evenly distributed across all geographies. Many times, this is not the case; it is possible that due to some localized issue, the application is showing 100% failure in a particular location but performs well across other regions. When aggregated, the failure rate falls within the threshold-based alerts set by the operations team. As a result, the team sees green where it should have seen red.
Similar issues may occur due to the lack of tools and solutions that are capable of detecting anomalies and outliers. As a remedy, many organizations today collect logs, measure different metrics, and have even instrumented their code for tracing different issues. While these measures allow them to detect anomalies, the problem now is that there are too many of them. It is not easy in a live environment to find the golden thread or correlate events and anomalies in high-cardinality data from logs and metrics and get to the root cause of an issue.
This is where observability offers a way forward. Observability allows teams to draw one-to-many, many-to-one, and one-to-one correlations with reduced noise and false alarms. They get intelligent alerts and actionable, predictive intelligence to resolve issues faster.

Major Components of Observability
In most discussions around observability, metrics, logs, and traces are termed as the three key pillars for success. Data across these three constituents can be aggregated and analyzed to enhance observability.
The Three Pillars of Observability
Logs:
By monitoring logs, one can understand the entire chain of events before or after a major issue in a system and take remedial actions accordingly. Logs form the basic building block of most Security, Information, and Event Management (SIEM) tools, that rely on their collection, normalization, and analysis. However, it is also seen that many organizations maintain logs only as a compliance mandate and rarely utilize them for performance monitoring purposes. It is because traditionally, most log management tools have supported only post-event batch analytics, which has its merits, but it doesn’t do well in terms of gathering real-time intelligence.
Metrics:
As metrics are only numbers, it is far more efficient to compress, store, process, and retrieve them as compared to logs, which can be in plaintext or in JSON format and vary a lot in terms of their verbosity. It is easier to fit metrics into mathematical and statistical models for correlation and visualization purposes, which is what many Business Intelligence tools offer. Also, the overhead with metrics in their storage, transfer, analytics, etc., is fixed, while logs can easily snowball and overwhelm a system during peak traffic, outage, or a security incident. Despite their advantages, it is not always easy for organizations to decide their resolution (the interval at which metrics are collected) and also which metrics they should monitor. For instance, even though the DevOps Research and Assessment (DORA) group’s metrics are taken as gospel for tracking DevOps success, many enterprises have a hard time getting started. Organizations are often unable to drill through and across various metrics.
Traces:
As organizations refactor their monolithic applications for microservices and deploy them over ephemeral containers, it has become increasingly difficult for them to keep track of execution paths. Distributed tracing is seen as a viable solution for monitoring microservices-based applications. In simple terms, a trace is a record of a series of all related events that occur as a result of a user request. While there are frameworks such as OpenTelemetry that allow the generation, collection, and export of telemetry data for observability, to realize the full potential of tracing, organizations need to instrument every part of the application (a herculean task in itself) and monitor them continuously as it is not always possible to replicate unusual events.
This is where vendors offering distributed tracing differ in their approach. Some claim that sampling of traces is a more efficient and pragmatic approach to dealing with observability at scale. While others emphasize that sampling of traces beats the whole purpose, and one should trace every request. There is no clear evidence as to which of these methods is better at this moment.
What Else is Required for Observability?
While the three pillars discussed above offer telemetry data from the back-end of applications, using both agent-based and agentless approaches, the data doesn’t provide the full picture.
End-User Experience Data:
Organizations also need to include black box monitoring techniques to get end-user perspective. Synthetic monitoring tools offer this capability allowing organizations to measure their web performance from different polling servers at a set frequency. It not only helps track availability across regions but allows organizations to monitor critical workflows (e.g., search, cart checkout) by simulating visitor interactions. Further, organizations can capture customer data from their support desks and social channels to get a holistic view of customer satisfaction levels.
Analytics:
The end goal of bringing observability across systems is to improve decision-making with lesser noise. This is where analytics plays a crucial role. With machine learning, organizations can correlate all their data to get intelligent alerts (reduced false positives/negatives) and predictions and start seeing improvements in various performance metrics.
Benefits of Observability
Infrastructure Cost Savings:
Organizations often fail to have full control over their multi-cloud infrastructure spending. With observability, they can reduce over-provisioning and optimize and allocate their resources for high efficiency.
End-to-End Visibility and Control:
Observability allows end-to-end visibility over the entire stack covering hybrid and multi-cloud environments and can help in reducing virtual sprawl, improving container orchestration, and monitoring microservices-based applications.
Enhanced Customer Experience:
Better performance on metrics such as Mean Time to Detect (MTTD), Mean Time to Resolve (MTTR), Application Uptime, etc., ensures reduced customer churn and better NPS scores.
Integrated DevOps:
As everyone gets on the same page in terms of application performance, it is easier to align development and operations. The shift-left approach for testing and canary deployments can further augment observability, providing teams a less risky, real-world assessment of their applications, along with increased flexibility to roll back, mitigate damage, resolve issues, and make improvements.
Increased Security:
Observability simplifies the detection and mitigation of a myriad of cyber threats and vulnerabilities. It also allows organizations in heavily regulated industries to demonstrate compliance and ensure all procedures are followed strictly to safeguard data.
Challenges
Organizational Barriers:
While organizations prefer to standardize processes and tools, at the end of the day, they are driven by professionals who have their own preferences. For example, people handling databases and networking tend to stick to their niche tools. That is why getting buy-in from everyone for observability can pose certain challenges in large enterprises.
It is seen that enterprise teams use several tools for monitoring their network, applications, and hybrid infrastructure, which often have overlapping features. Despite this complexity, they prefer to continue using their own set of tools. Implementing observability and ensuring its adoption in such an environment can be challenging.
Cloud-Native Applications:
Today, most organizations rely on hybrid and multi-cloud setups for their applications. These applications, with their microservices architecture and container deployments, offer better scalability, availability, and efficiency than traditional deployments. However, monitoring these applications is a complex challenge. Kubernetes, which is the de-facto standard for container orchestration, involves many components, including pods, namespaces, services, etc., that require new approaches for monitoring and management. Many enterprises spend significant time and effort in creating a monitoring setup for cloud-native applications using open-source tools. However, gaining observability into the Kubernetes environment is still a complex puzzle for most organizations.
Complex Toolchains:
The ecosystem of monitoring tools has become complex over a period. Today, teams have to monitor different dashboards to capture network errors, security vulnerabilities, load times, and several other issues affecting an application’s availability and performance. It is not simple to integrate these tools and ensure the development and operations teams remain on the same page. Further, organizations can struggle to identify the right observability platform for their needs as many vendors offer solutions with varying depth and ease of implementation. There are also traditional monitoring tools rebranded as observability tools, which can further complicate vendor selection.
How to Get Started?
There is no one-size-fits-all, off-the-shelf solution for observability implementation. Further, in addition to the instrumentation of code, which is a development overhead, organizations need to strategically bring major components of monitoring under the single umbrella of observability, which might require the engagement of different teams. Hence, organizations should consider engaging all teams in the implementation and evaluate observability tools and platforms which are intuitive or have a shorter learning curve.
One of the likely challenges in this initial consolidation of monitoring tools is that it could lead to alert fatigue. Finding the right thresholds for alerts and reducing the signal-to-noise ratio will take some time. Intelligent alerts based on machine learning can help in this regard.
Further, improving observability across tools and processes is not a one-time fix and might require frequent adjustments and tuning. Instead of aiming to create comprehensive dashboards, organizations should look forward to creating dashboards quickly to meet their immediate needs first. For example, an operations team focussing on specific issues, automations, schedules, etc., would want a different view of their processes as against managers and CXOs, who would prefer only high-level business metrics and dashboards. That’s why the ability to create on-demand dashboards without significant coding or integration efforts can prove to be highly valuable.
Gathr offers a simple approach to improving full-stack observability by starting small and building iterative solutions – a bottoms-up approach to improving observability if you will. You can gather observability data from your applications, infrastructure, and different services using pre-built, bi-directional connectors for unified analytics, visualization, alerting, automation, and more. Gathr also offers some ready-to-use applications that are built using connectors for ZAP, ServiceNow, Jira, Git, SonarQube, Jenkins, Kubernetes, and more. Further, Gathr can augment the capabilities of your existing monitoring solutions by integrating seamlessly with tools such as Dynatrace, New Relic, Splunk, Sumo Logic, and more.

Table of Contents
- Introduction
- What is Observability?
- Difference Between Monitoring and Observability
- Why Do Organizations Need Observability?
- Have You Also Experienced the Watermelon Effect?
- Major Components of Observability
- The Three Pillars of Observability
- What Else is Required for Observability?
- Benefits of Observability
- Challenges
- How to Get Started?
MEET GATHR

Turn raw data into business outcomes, at scale and 50x faster
-
Ingestion
-
ETL
-
CDC
-
DQM
-
ML
-
Insights
-
Atomation
-
Xops
-
Business Apps
Recent Posts
View more postsBlog
Blog
Blog
Blog